
Most agency dashboards are built around revenue, and revenue is the one number on them you can no longer do anything about. It is true, it matters, and it reports a decision somebody made two months ago. A dashboard worth opening on a Monday leads with the numbers that are still in play.
Why is revenue the wrong headline?
Because it is the last thing to move. A badly priced engagement taken in week zero does not show up in revenue until the work has been delivered and invoiced, by which point the capacity is spent and the client relationship is set.
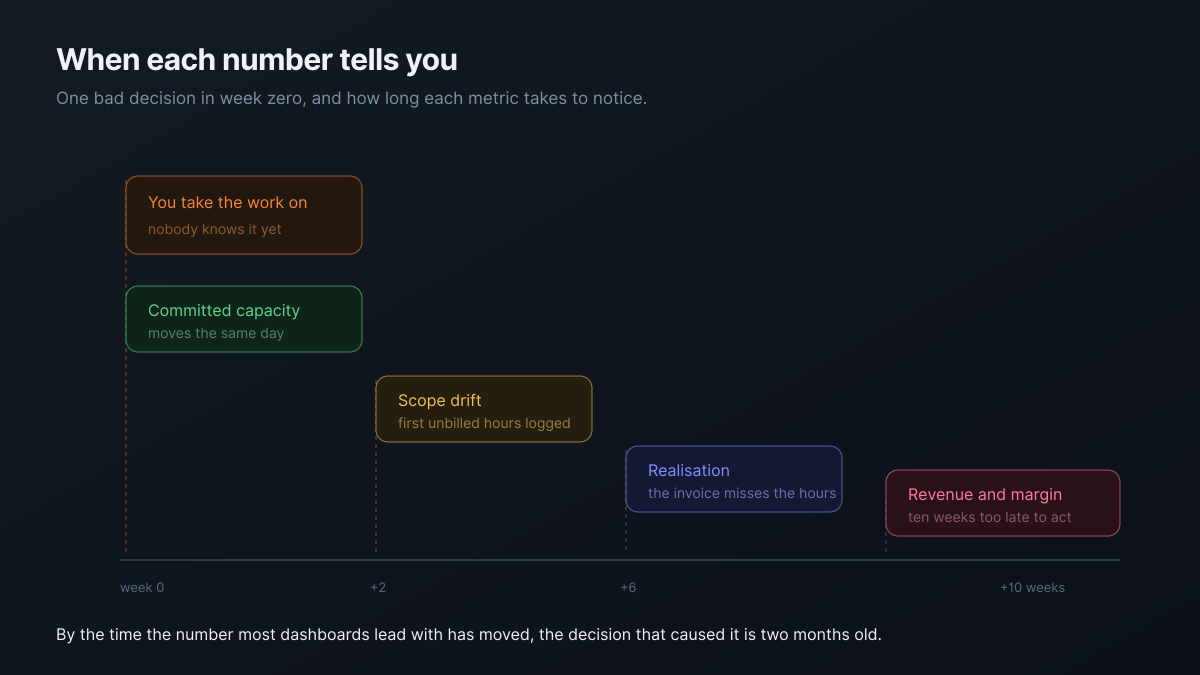
The sequence is the argument. Committed capacity moves the day you say yes. Scope drift appears within a fortnight, as soon as the first unbilled hours are logged. Realisation shows up when the invoice fails to match the hours. Revenue is last, and it confirms what four earlier signals already told you.
A lagging indicator is not a bad number. It is a receipt. The problem is building the dashboard around the receipt.
What are the four numbers that are still actionable?
Committed capacity, scope drift, realisation, and pipeline coverage. Each one moves early enough that seeing it change gives you a decision rather than an explanation.
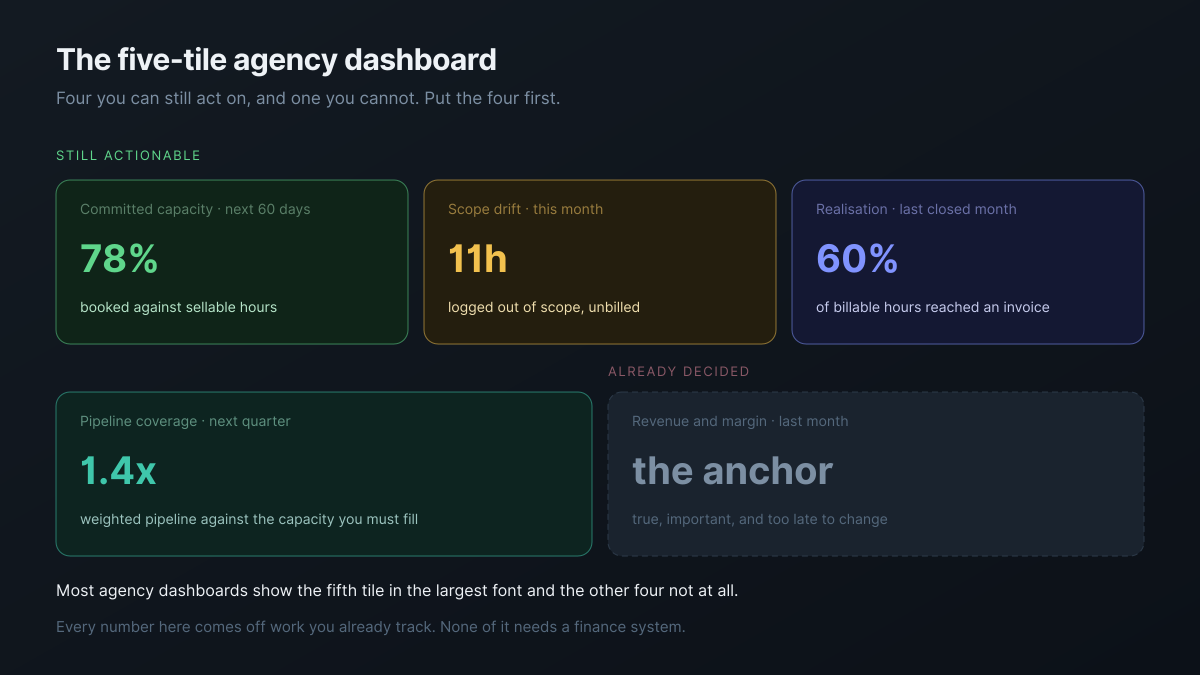
- Committed capacity, next 60 days. What share of sellable hours is already promised. Too low and you have a selling problem this month; too high and you have a delivery problem next month, and both are easier to fix in advance.
- Scope drift, this month. Hours logged against work tagged out of scope. This is the earliest financial signal an agency has, and almost nobody puts it on a dashboard.
- Realisation, last closed month. The share of billable hours that reached an invoice. Agency utilisation rate covers why this one matters more than utilisation on its own.
- Pipeline coverage, next quarter. Weighted pipeline against the capacity you have to fill. It is the only number here that tells you about revenue you have not sold yet.
Should revenue be on there at all?
Yes, as the anchor rather than the headline. It is the number that keeps the other four honest — four healthy leading indicators and falling revenue means one of your definitions is wrong, and that is worth knowing.
The change is one of position and size rather than presence. Put the four in front, give revenue its own section labelled as history, and the conversation in the Monday meeting shifts from explaining last month to deciding this one.
How often should each one be read?
On different clocks, which is the part most dashboards get wrong by refreshing everything monthly.
| Number | Read it | Why that cadence |
|---|---|---|
| Committed capacity | Weekly | It changes every time someone says yes |
| Scope drift | Weekly | Catching it at 2h is a chat; at 20h it is a negotiation |
| Realisation | Monthly | It needs a closed month to mean anything |
| Pipeline coverage | Weekly | Decisions about selling are made weekly |
| Revenue and margin | Monthly | It cannot change faster than that |
The weekly ones are cheap to read because they come off work your team is already updating. That is the practical test for whether a dashboard survives: if producing it requires anyone to assemble anything, it will be accurate for two months and then quietly stop.
Where does this data come from?
The work itself, if the work is tracked as rows rather than in documents. Committed capacity is assignments with dates. Scope drift is items tagged out of scope. Realisation is hours against invoices. None of it requires a finance system, and none of it requires anybody to fill in a separate report.
That is the honest version of what a work platform contributes here. It does not calculate your margin — that lives in your accounting software and should. What it can do is surface the four leading numbers without a monthly assembly job, because they are properties of work that already exists.
| Dimension | A spreadsheet assembled monthly | Atwork |
|---|---|---|
| Where the inputs come from | Exported and pasted | The work items themselves |
| How current it is | As of whenever it was built | Now |
| Effort per refresh | Half a day | None |
| Replaces your accounting system | No | No — and should not try |
What if you only have room for one number?
Scope drift. It is the earliest, the cheapest to collect, and the one that most reliably predicts a bad quarter, because it catches the decisions nobody registered as decisions.
Committed capacity is the better second choice, since it is the only one that tells you about a problem before the work starts rather than while it is running. How to stop over-servicing retainer clients covers how to generate the scope-drift number in the first place, and agency capacity planning covers what to do when committed capacity goes the wrong way.
Where should you start this week?
Add one tile. Not a dashboard project — one number, the scope-drift one, for the current month. If your team is already tagging requests in or out of scope, the number exists and nobody has added it up.
Read it every Monday for a month before you add a second tile. A dashboard that gets read is worth more than a complete one that gets built and then ignored, and the fastest way to build an ignored dashboard is to launch it with five tiles nobody asked for.
The Retainer Management template ships the sheets several of these come off, and the agencies overview covers the wider setup. If the question underneath is whether individual accounts are carrying their cost, how to tell if a retainer is actually profitable is the per-account version of this.
Add one tile this week: hours logged out of scope this month. Read it every Monday before you add a second. Start free