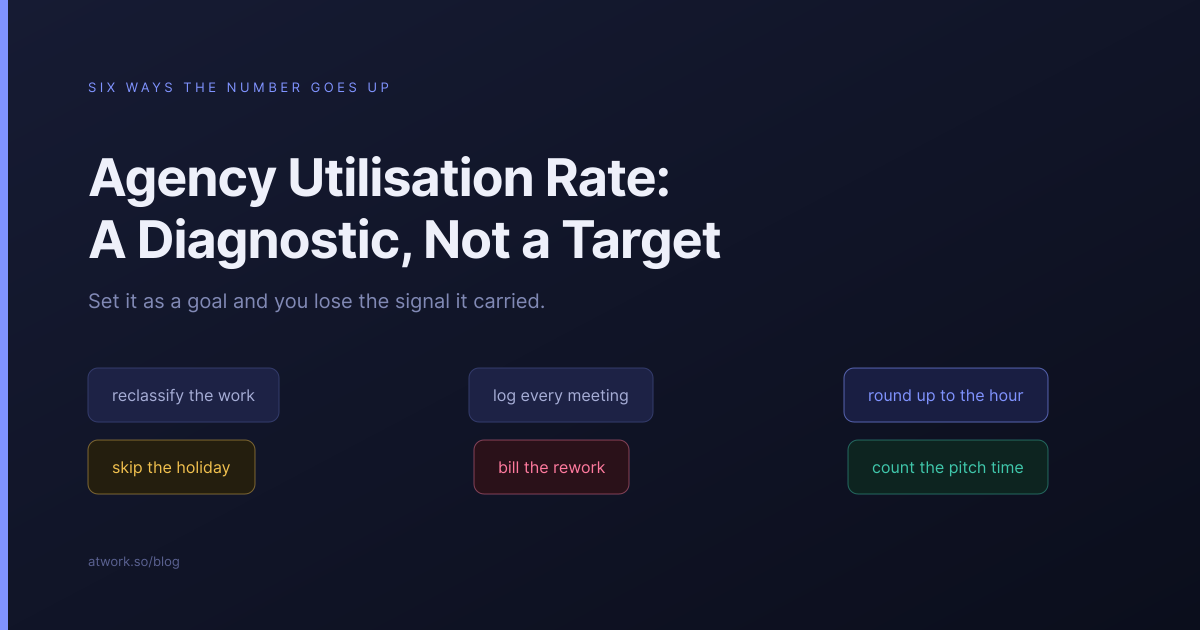
Utilisation rate is the first number most agencies start tracking, and the first one they start gaming. The formula is simple enough that it feels like a fact: billable hours divided by available hours. The trouble begins when it stops being a thermometer and becomes a goal, because there are at least six ways for a team to raise the number without the agency earning a penny more.
What does utilisation rate actually measure?
How much of your available time was spent on work tagged as client work. That is all. It measures capacity consumed, not revenue earned, and the distance between those two ideas is where most of the money goes missing.
The arithmetic is uncontroversial: thirty-one billable hours out of a forty-hour week is 78%. What the arithmetic cannot see is whether those thirty-one hours were work someone agreed to pay for, work you gave away, or work you were redoing because it was wrong the first time. All three look identical once they are logged as billable.
| Number | What it answers | What it cannot see |
|---|---|---|
| Utilisation | How much available time went to client work | Whether that work was paid for |
| Realisation | How much of that time reached an invoice | Whether the price was right |
| Effective hourly rate | What an hour of your team actually earned | Nothing — but it needs both of the above to exist |
Why does setting a utilisation target break it?
Because the number is easier to move than the thing it stands for. Announce that everyone should be at 80% and you will get 80%, reliably and quickly, and almost none of it will come from selling more work.
- Reclassify the work. Internal time becomes client time with a dropdown change nobody audits.
- Log every meeting. The status call, the handover, the internal review about the client all become billable by association.
- Round up to the hour. Forty minutes becomes an hour, six times a week, per person.
- Bill the rework. The hours spent fixing your own error are indistinguishable from the hours that created the work.
- Count the pitch. Unpaid business development quietly lands in a client code.
- Skip the holiday. Available hours go down, so the percentage goes up while the team gets worse.
None of these require dishonesty. They require a person who has been told a number matters filling in a form that offers no way to express the distinction. That is a design problem, not a character problem.
What does the same number look like on two different teams?
Identical, which is the whole difficulty. Two teams both logging thirty-one billable hours out of forty report the same 78%, and one of them has had a good month while the other has given away most of a week.
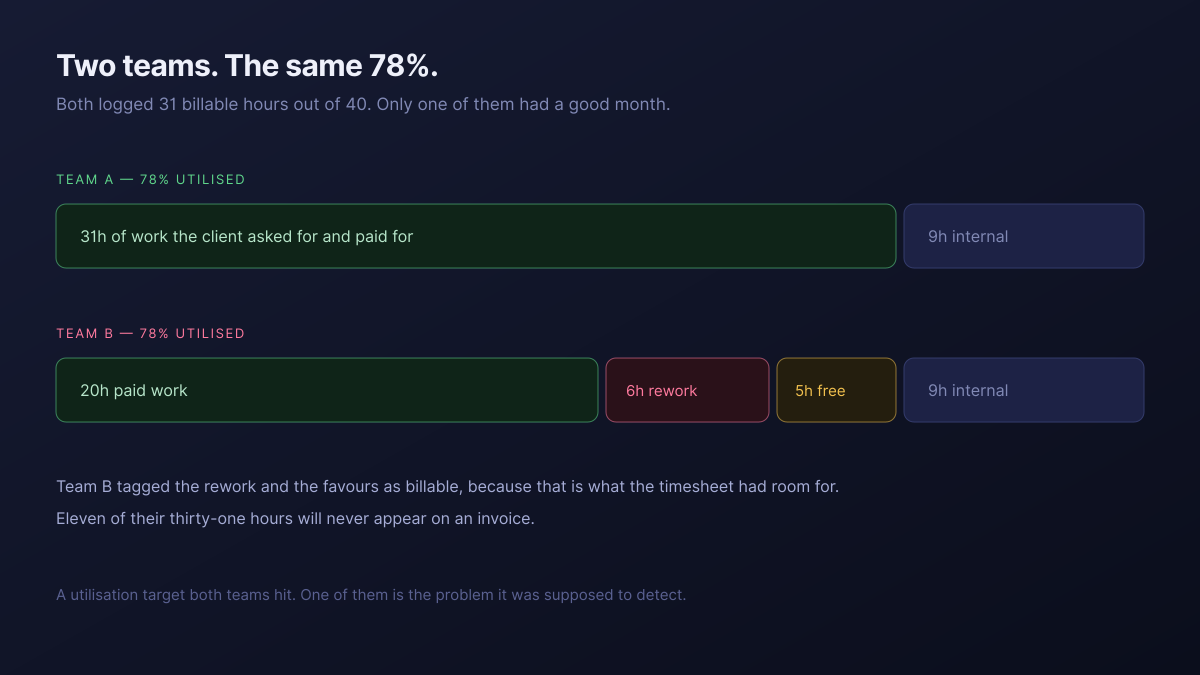
The second team is the one the metric was introduced to detect, and it is the one the metric reports as healthy. Worse, if utilisation is the number the agency manages by, that team has no incentive to correct the classification — doing so would make their figures look worse while their actual work improved.
The unpaid hours in that example have a name and a cause, and they are worth attacking directly rather than through a percentage. That is the subject of how to stop over-servicing retainer clients.
Which number should you read beside it?
Realisation — the share of those billable hours that actually reached an invoice. Utilisation stops measuring one step before the step that pays salaries, and the gap between the two is the most informative number an agency can produce about itself.
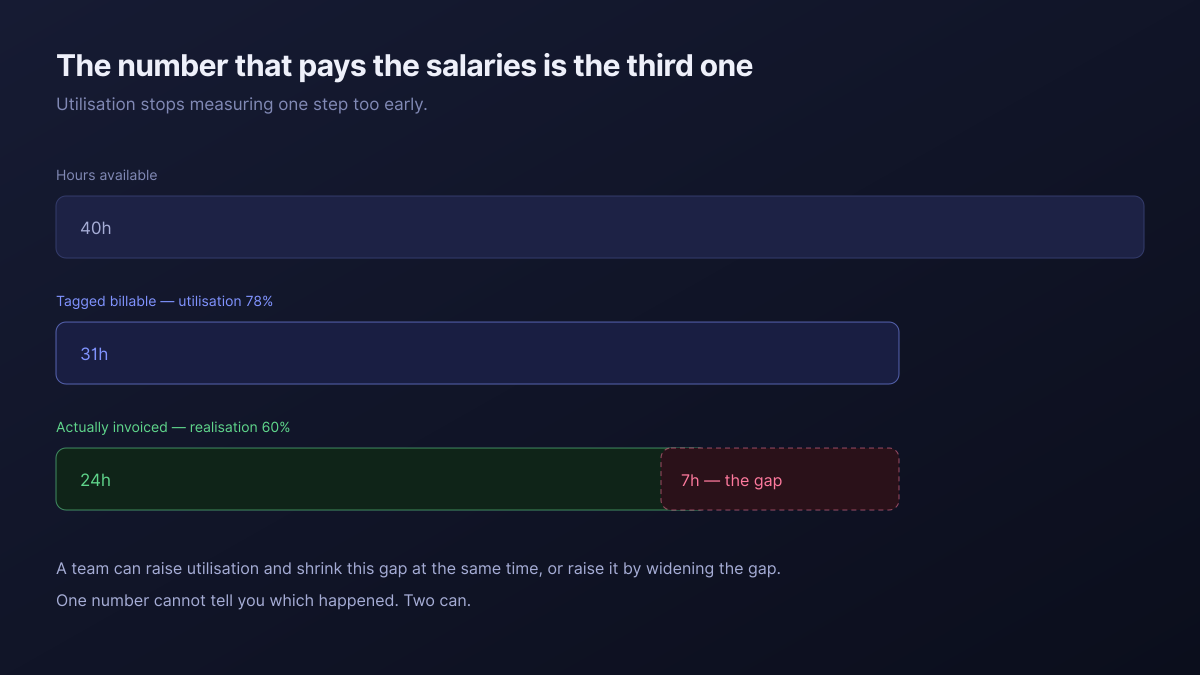
Read together, the two numbers tell a story neither can tell alone. Utilisation up and the gap shrinking means you sold more and delivered it. Utilisation up and the gap widening means you absorbed more. One number cannot distinguish those; two can, and the second one is usually already available from the same records.
A team can improve utilisation by selling more work or by giving more away. The number looks the same afterwards, which is the only thing you needed it to tell you.
What is a good utilisation rate?
The honest answer is that the published benchmarks are less useful than they look, because agencies do not agree on the denominator. Some count a 40-hour week, some subtract holiday, some subtract internal meetings, some count only delivery staff. A headline percentage assembled from all of those is not something your figure can be meaningfully compared against.
The comparison that does work is your own, over time, with the definition held still. Write down what counts as available and what counts as billable, do not change it for a year, and watch the trend. A number you can trust against last quarter beats an industry average you cannot reproduce.
There is also a ceiling worth respecting. A team at very high sustained utilisation has no slack for the pitch that wins next quarter's work, the training nobody schedules, or the week somebody is ill. Running hot looks efficient in the month and shows up later as turnover, which is the most expensive line an agency has. Agency capacity planning covers where that slack should sit.
How do you track it without a timesheet culture nobody believes?
Attach the hours to the request rather than to the client. If time is logged against a specific piece of work that already carries its own scope and status, the classification comes from the work instead of from someone's memory at the end of the week.
| Dimension | A timesheet report | Atwork |
|---|---|---|
| What the hours attach to | A client, via a code | The specific request, as an item |
| Separates rework from new work | Only if someone made a code for it | Yes, when the item says so |
| Shows the utilisation-to-invoice gap | Rarely, and never in the same view | Yes — both numbers come off the same rows |
| Survives people not filling it in | No | No — nothing does |
That last row is not a throwaway. No tool solves a team that does not record its work, and any vendor telling you otherwise is selling you something. What a tool can do is make recording take five seconds instead of five minutes, and make the classification obvious rather than a judgement call at the end of a tired week.
Where should you start this week?
Pick one month you have already closed and calculate realisation next to utilisation. You almost certainly have both inputs — logged hours and invoices — and have never put them side by side. The gap is the number worth knowing, and it takes an afternoon to produce once.
Then stop reporting utilisation on its own. Report the pair, every month, with the definition written at the bottom so nobody relitigates it. A single number invites a target; a pair invites a question, and the question is the thing that changes how the agency runs. If the answer turns out to be a resourcing problem rather than a selling one, managing agency freelancers covers the overflow, and how to tell if a retainer is actually profitable turns both numbers into money.
The Agency Client Delivery template ships the sheets these come off, and the agencies overview covers the wider setup.
Calculate realisation beside utilisation for one closed month. Then never report either of them alone again. Start free