How to see where work gets stuck with the process map view
A process map shows how the cards in a sheet move between the values of one field, usually its statuses. Each status is a box with the cards in it now, each arrow counts the moves from one status to another, and red arrows show work that went back a step. Use it to find the step where work piles up and the cards that have waited longest there. Anyone who can change a sheet's structure can add one.
Before you start
- You need permission to change the sheet's structure to add a view.
- The sheet needs a Status, Select, Person or Team field that holds one value per card. Without one, the map shows Nothing to group by and an Add field button.
Add a process map
- Open the sheet and click + at the end of the view tabs.
- Under Specialized, choose Process map.
- Keep the name Process map or type your own.
- Click Create.
The map opens on the sheet's Status field over the last 7 days. A sheet without a Status field starts on its first Select, Person or Team field.
Read the map
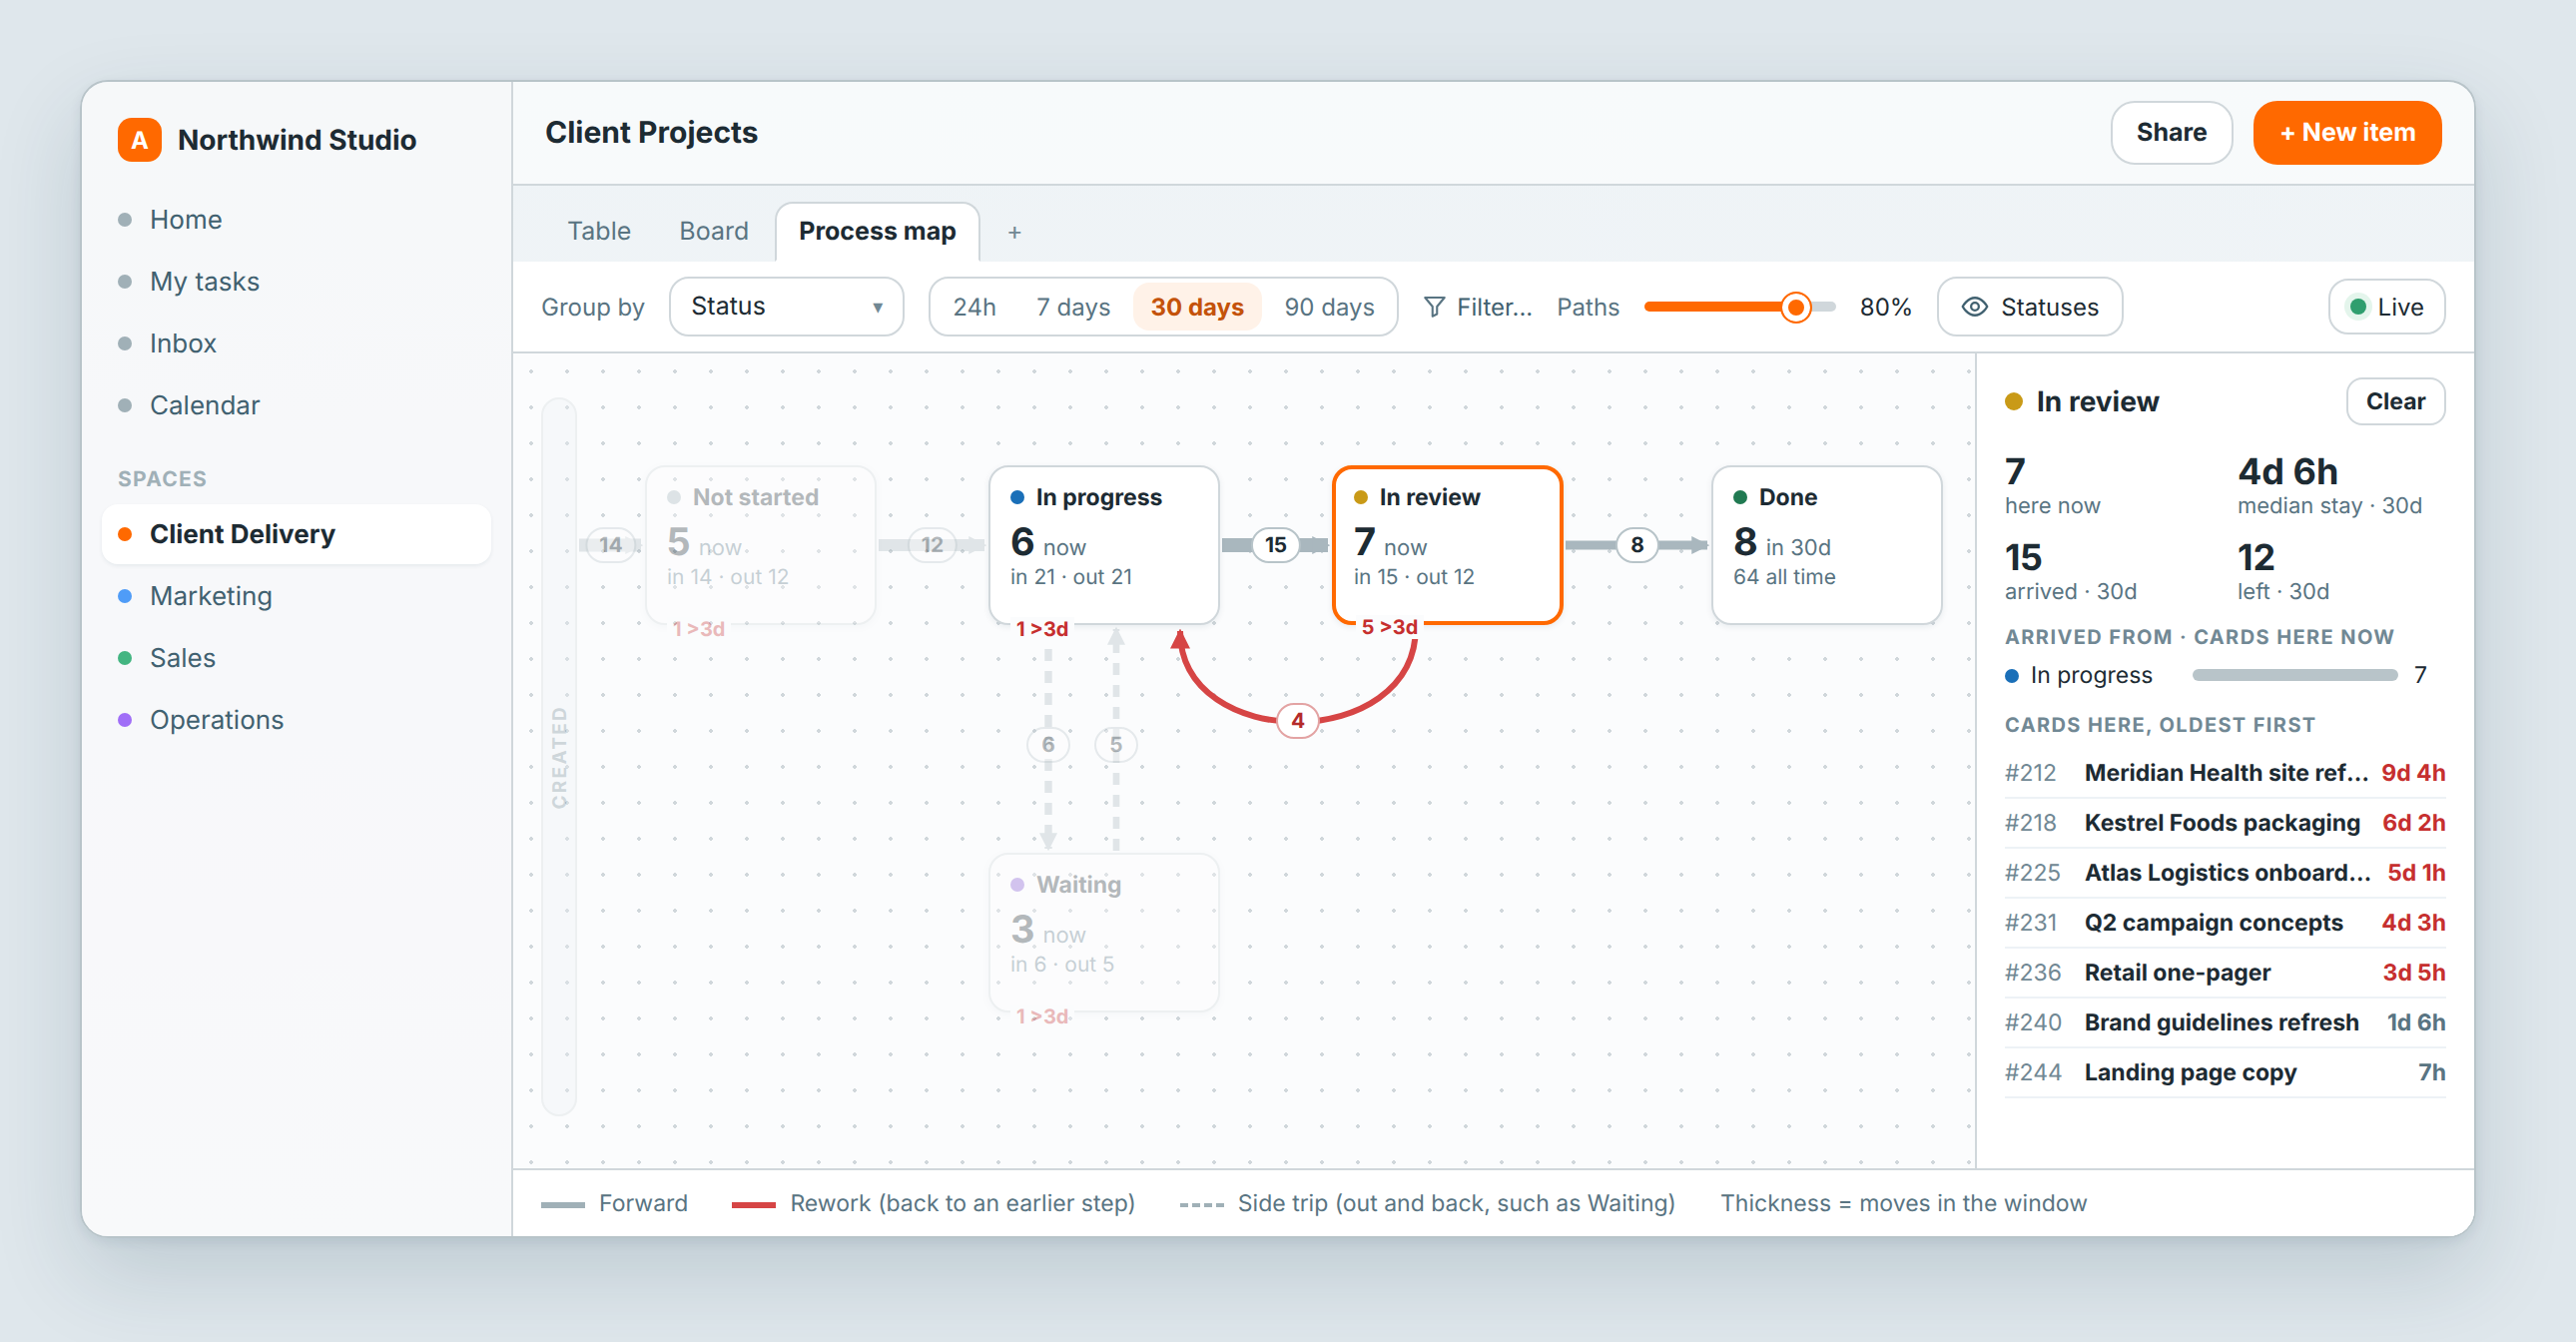
- Boxes are the field's values. The big number is the cards there now. in and out count the moves into and out of that value in the time window.
- A red number under a box counts the cards that have been there for more than 3 days.
- A finished status, such as Done, counts the cards that arrived in the window instead, with the all time total under it.
- Arrows are moves from one value to another. The number on an arrow is how many moves it carried, and a thicker arrow carried more. Point at an arrow to see its share of the moves out of that value.
- Created, on the left edge, is where new cards come in.
- Grey arrows go forward. Red arrows are rework: cards that went back to an earlier step. Dashed arrows are side trips to a status that cards usually leave by going back where they came from, such as Waiting.
With nothing selected, the panel on the right sums up the window: the moves, the cards that finished, the share of step moves that are rework, and the biggest queue.
Find the cards that are stuck
- Click a status box. The panel shows here now, the median stay, Arrived from · cards here now with the status each card came from, and Cards here, oldest first. Stays over 3 days are red.
- Click a card in the list to open it.
- Click an arrow, or the number on it. The panel shows that path's moves, Moved by with who made them, and Latest moves.
- Click Clear to go back to the summary.
The cards at the top of Cards here, oldest first are the ones to follow up first.
Change what the map shows
| Control | What it does |
|---|---|
| Group by | Follows another Status, Select, Person or Team field. Group by a Person field, such as Assignee, to see hand-offs between people. Agents show with an AGENT tag. |
| 24h, 7 days, 30 days, 90 days | The time window for moves and arrivals. |
| Filter... | Counts only the cards that match the filter, such as one client's projects. |
| Paths | Shows the busiest arrows that together carry this share of all moves. It starts at 80%. Set it to 100% to see every arrow. |
| Statuses | Untick a value to take it off the map. Moves through it are drawn from the value before to the value after. Show all brings every value back, and Reset layout puts moved boxes back where they started. For a Person, Team or Select field, the button shows People, Teams or the field's name. |
| Live | Shows moves as they happen: each card's number travels along its arrow. Click it to pause the map, and it shows Paused. Click it again to catch up. |
Drag a box to move it, and the map keeps it there. Grouped by a Person or Team field, the map shows the 40 busiest people or teams, and the values menu says how many more are not shown.
Who sees your changes
If you're an Editor or Admin on the view, your group-by field, time window, Paths setting, hidden values and box positions save to the view for everyone who opens it. If you're a Viewer or Operator, they last only for your own session. See Share a view.
What a process map can't show
- It follows one field at a time, and only fields that hold one value. A field with several values per card, such as a multi-select, can't be grouped.
- It counts moves between values of that field, not edits to other fields.
- The longest time window is 90 days. Only the all time total on a finished status reaches further back.
Related: Views: see the same data 12 different ways · Filter, sort and group · Board view · Share a view